Rubyでグラフを書く
New Relic(http://www.newrelic.com/)のツールとか見て、そうかブラウザでパフォーマンスモニタリングすればいいんだと思い、とりあえずグラフをブラウザで出す実験をしてみました。最終的には、色々なプロファイル情報をターゲットプログラムの実行時に得られるようにしたいです。
ポイントは次の2点です。
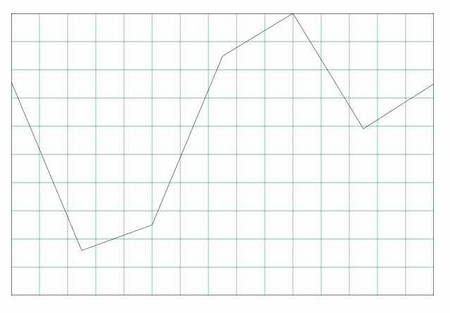
最後に示すプログラムを実行して、ブラウザでttp://localhost:8088/graphをアクセスするとこんな感じのグラフを表示されます(リンクになっちゃうのでhを省いてあります)。 怖いのでlocalhostでしか見えないようにしてあります。
ソースです。
ちなみに、すごく分かりにくいですが、
@graph_gen.graph_script([[[10, 100], [20, 21], [30, 33], [40, 112], [50, 132], [60, 78], [70, 99]]])
となっている、ところの配列がグラフの元データです。
今後、もうちょっとまともなインタフェースにして独立したライブラリにまとめる予定です。
require 'webrick'
require 'erb'

include WEBrick

class GraphGen
  def initialize(xsize, ysize)
    @xsize = xsize
    @ysize = ysize
  end

  def set_data_range(minx, maxx, miny, maxy)
    @minx = minx.to_f
    @maxx = maxx.to_f
    @miny = miny.to_f
    @maxy = maxy.to_f
  end

  def position_in_graph(x, y)
    dx = @maxx - @minx
    posx = ((x - @minx) / dx) * @xsize

    dy = @maxy - @miny
    posy = ((y - @miny) / dy) * @ysize

    [posx, posy]
  end
end

class GraphGenCanvas<GraphGen
  BODRER_SCRIPT_TEMPLATE = <<BEOS
    function draw_border() {
      var canctx = document.getElementById('border').getContext('2d')
      canctx.rect(0, 0, <%= @xsize%>, <%= @ysize%>);
      canctx.stroke();

      canctx.strokeStyle = 'rgb(0, 128, 128)';
      canctx.lineWidth = 0.5;

      var cnt = 0;
      while (cnt < <%= @ysize%>){
        cnt += 40;
        canctx.beginPath();
        canctx.moveTo(0,  cnt);
        canctx.lineTo(<%= @xsize%>,  cnt);
        canctx.stroke();
      }

      cnt = 0;
      while (cnt < <%= @xsize%>){
        cnt += 40;
        canctx.beginPath();
        canctx.moveTo(cnt, 0);
        canctx.lineTo(cnt, <%= @ysize%>);
        canctx.stroke();
      }
    }
BEOS

  GRAPH_SCRIPT_BEGIN = <<GBEOS
    function draw_graph() {
      var canctx = document.getElementById('graph').getContext('2d')
      canctx.strokeStyle = 'rgb(0, 0, 0)';
      canctx.lineWidth = 0.5;
GBEOS

  GRAPH_SCRIPT_END = <<GEEOS
      canctx.stroke();
    }
GEEOS

  def initialize(xsize, ysize)
    super
    @border_erb = ERB.new(BODRER_SCRIPT_TEMPLATE)
  end

  def border_script
    @border_erb.result(binding)
  end

  def graph_script(data)
    res = ""
    data.each do |gd|
      sd = gd.sort_by {|a| a[0]}
      sdx = sd.map {|a| a[0]}
      sdy = sd.map {|a| a[1]}
      ymin = sdy.min
      if ymin > 0 then
        ymin = 0
      end
      set_data_range(sdx.min, sdx.max, ymin, sdy.max)
      agraph = nil
      sd.each do |a|
        x, y = position_in_graph(a[0], a[1])
        y = @ysize - y
        if agraph then
          agraph += "canctx.lineTo(#{x}, #{y});\n"
        else
          agraph = "canctx.moveTo(#{x}, #{y});\n"
        end
      end

      res += "canctx.beginPath();\n"
      res += agraph
    end

    GRAPH_SCRIPT_BEGIN + res + GRAPH_SCRIPT_END
  end
end

s = HTTPServer.new(:Port => 8088, :BindAddress => "localhost")
trap("INT"){s.shutdown}

class GraphServlet<HTTPServlet::AbstractServlet
  SCRIPT = <<EOS
<html>
  <style type="text/css">
    canvas {position: absolute}
    canvas#border {left: 10px; top: 10px}
    canvas#graph {left: 10px; top: 10px}
  </style>

  <script type="text/javascript">
   <%= @graph_gen.border_script %>
   <%= @graph_gen.graph_script([[[10, 100], [20, 21], [30, 33], [40, 112], [50, 132], [60, 78], [70, 99]]]) %>

    window.onload = function() {
      draw_border();
      draw_graph();
    };

  </script>
  <body>
    <canvas id="border" width="600px" height="400px"></canvas>
    <canvas id="graph" width="600px" height="400px"></canvas>
  </body>
</html>
EOS

  def do_GET(req, res)
    if !defined? @graph_gen then
      @graph_gen = GraphGenCanvas.new(600, 400)
    end

    res.body = ERB.new(SCRIPT).result(binding)
    res['Content-Type'] = "text/html"
  end
end

s.mount("/graph", GraphServlet)

s.start